Using Data Science to Bring Joy and Curiosity to Mathematics
Rusty Bresser
Making sense of data in our complex world is becoming an essential part of life and being able to analyze and understand what data is telling us is crucial to being an informed citizen.
Data can tell us who might win an election, which car model is safest, what the life expectancy is for a person our age, what the risk factors are for engaging in certain behaviors, what the likelihood is that interest rates will rise, what the trajectory is of a virus that is putting the world at risk, and the list goes on.
Because data literacy is so important, putting data science at the forefront of math instruction is essential. In this post, we will share the different ways that students in San Diego City Schools engaged in data science during their summer Math Explorer Camp. Math Transformations consultants worked alongside math coaches and classroom teachers to engage K-8 students with the goal of bringing joy and curiosity to mathematics.
Many of the activities that the students experienced this summer focused on or integrated data science, engaging in what Jo Boaler refers to as Data Talks, which are short 5-10 minute classroom discussions about data, similar to Number Talks.
Following are just a few of the week’s favorite activities.
Two Dice Sums, Grades K-8
This is one of my all-time favorites because it’s accessible, fun, and can challenge students of any age, including adults! See a copy of the game directions here: Two Dice Sums.
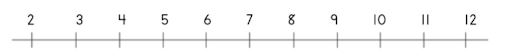
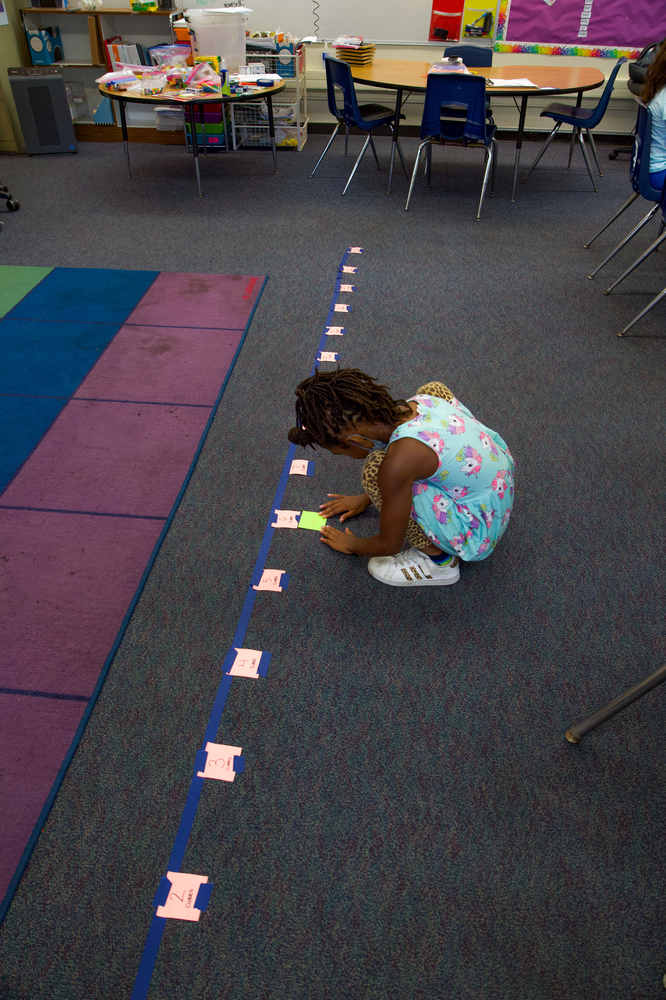
- Each player makes a number line for the sums 2-12 (see below).

- Players take 11 counters and place them on their number line in any arrangement (they can put more than one counter on some numbers and none on others).
- Players roll two dice, add the numbers together, and remove one counter that is on the number that matches the sum on the dice (players can only remove one counter on a turn).
- The winner is the first player to remove all eleven counters.
Players (and the class) keep track of the number of times each sum comes up when rolling two dice by tallying on a class chart. After several games, teachers facilitate a data talk asking their students questions such as…
- What do you notice about the data?
- What do you wonder?
- Which sums are most likely to happen? Why?
- Which sums are least likely to happen? Why?
- Are there any sums that are equally likely to happen? Why?
- How might you use the data to guide you in your next game of Two Dice Sums?
Another way to present the data about the sums of two dice is to show students a graphic representation (this one’s from youcubed) and ask them, “What is going on in this visualization?”
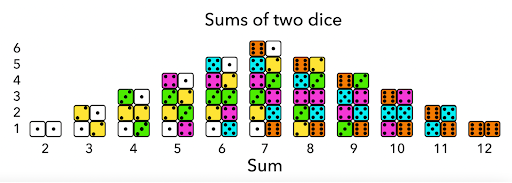
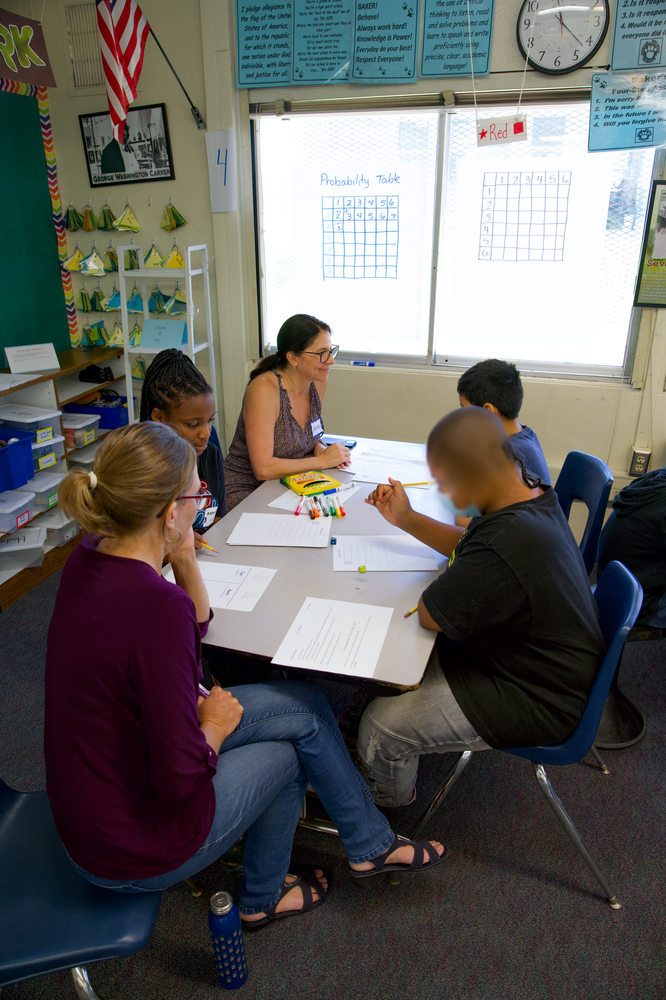
Below is a photo of middle school students figuring the probability of rolling different sums using a matrix. Check this link out for information on the probabilities for sums when rolling two dice: Probability.
Water Cup Challenge, Grades K-8
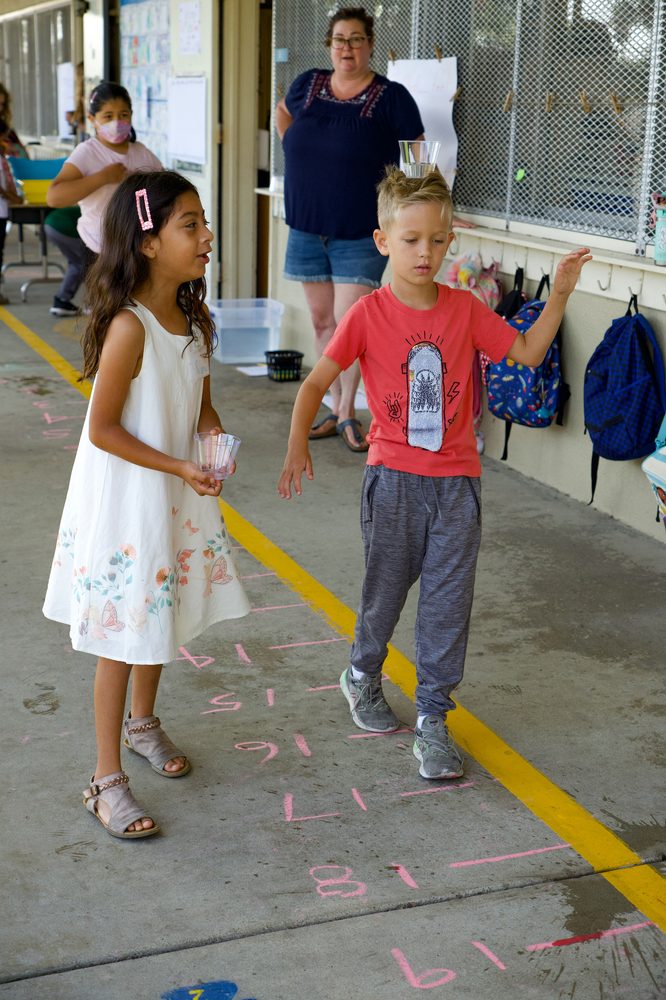 This was hilarious to watch! Each teacher created a number line 45 feet long in an outside hallway using chalk, then students took turns balancing a plastic cup of water on their head to see how far they could walk down the number line. The boy in the picture below was one of the champions as he traversed the number line forward and back several times. Finally, the cup tipped over, cooling him off!
Students experimented with how much water to use, and they had to calculate how many total feet they walked on the number line, charting their data on a class graph. At the end of the lesson, teachers facilitated a data talk asking questions such as…
- What do you notice about the data?
- What do you wonder?
- What was the least number of feet someone walked?
- What was the greatest number of feet someone walked?
- What is the range of the data?
- What is the mode (the number that occurs the most often)?
- What is the mean? Median?
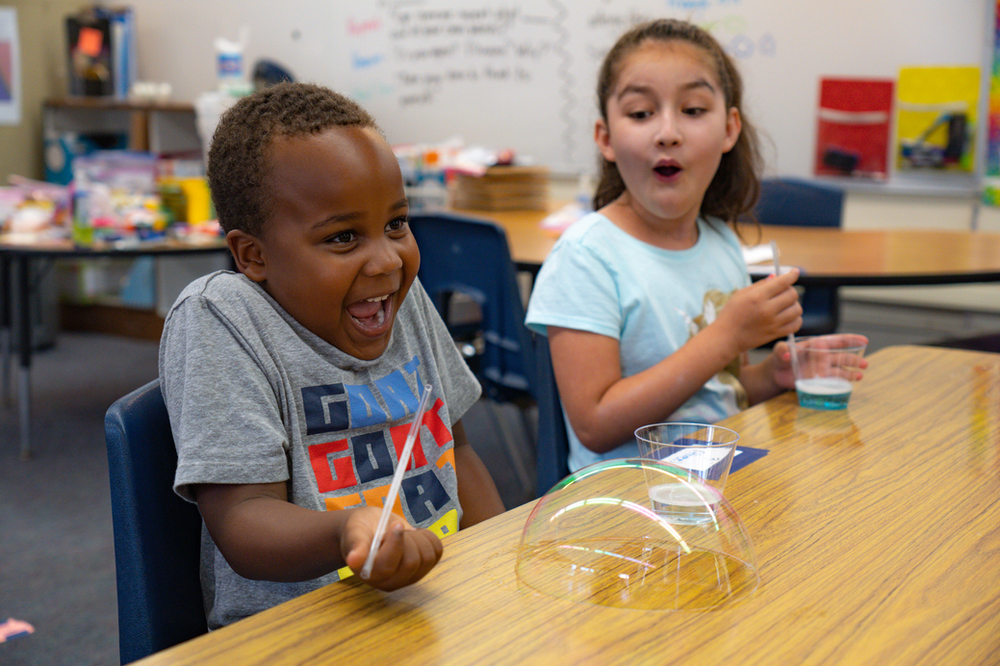
Measuring Bubble Diameters, Grades K-8
Students’ joy and curiosity are captured in the photos below as they experimented with soap solution to create bubbles on their tabletops. Students measured the bubbles’ diameters, graphing and discussing the results during a data talk. Check this link for the Lesson directions.
Empty the Bowl, Grades K-3
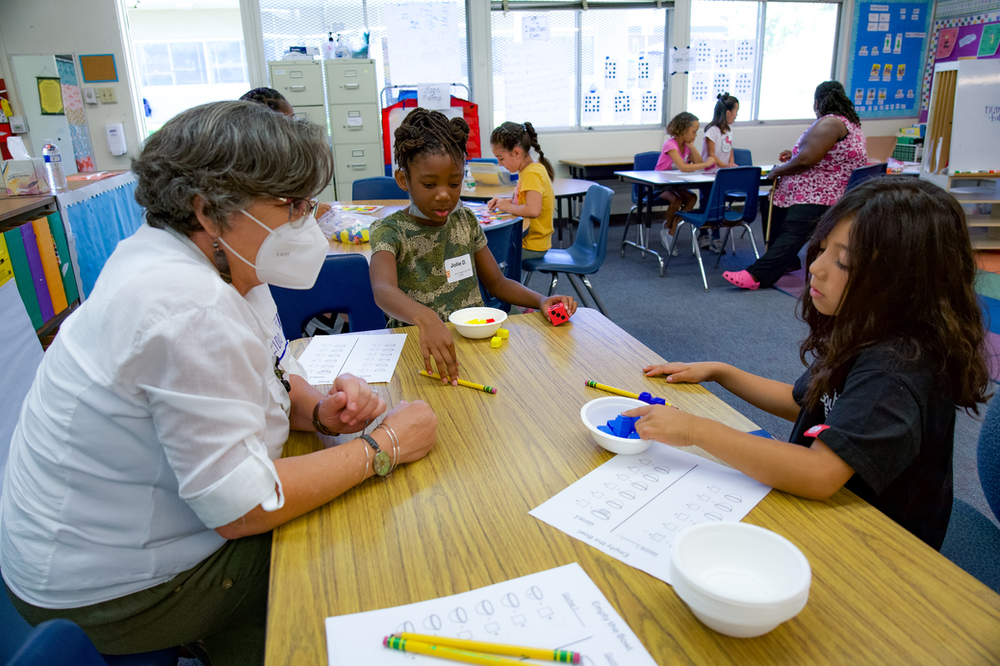
This simple yet engaging activity requires a bowl, 11 (or 20) counters, and a die. A player puts the counters in the bowl and predicts how many rolls it will take to empty it of counters. On each roll, the player takes counters out of the bowl that match the number on the die. Check here for directions: Empty the Bowl Lesson.
As students play, they keep track of how many rolls it takes to empty the bowl, and record tallies on a class chart. Once the class data is collected, teachers can facilitate a data talk. See Elba Ozakcay to the right teaching Empty the Bowl with a group of kindergartners.
Sink the Boat, Grades K-5
For this science & math lesson, students constructed boats from a square of aluminum foil. They experimented to see how many pennies of ‘cargo’ their boat could hold in water before sinking. Finally, students recorded on a class graph (see photo below) the number of pennies it took to sink their boat. Teachers summarized the lesson by facilitating a data talk with students.

Alka Seltzer Rockets, grades 2-8
This activity was a favorite at last year’s Alpine Summer Math Camp and a hit again this summer in San Diego. For this experiment, students make an Alka Seltzer Rocket using a film canister, water, and Alka Seltzer. They experiment making different recipes (different amounts of Alka Seltzer and water) to see which makes the film canister lid shoot the farthest/highest. Use this link to access directions for Alka Seltzer Rockets.
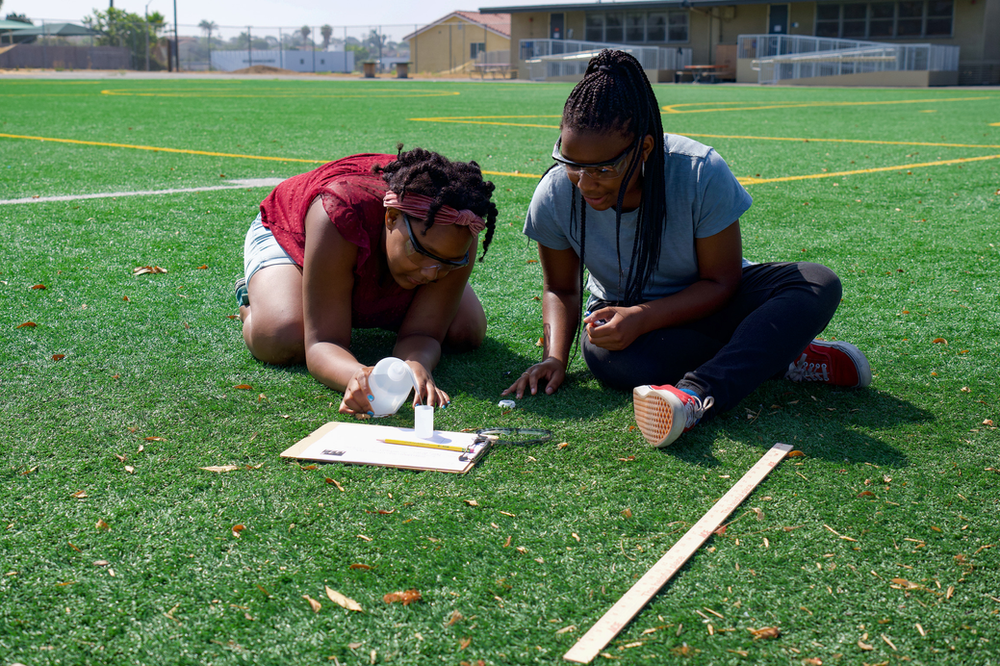
During the experiment, students try out several trials to see which ‘recipe’ works the best. They use fractions when creating their recipes: for example, ½ tablet and 2/3 full of water. Students can also explore ratios by writing their recipes as a ratio: ____ parts water: ____ parts Alka Seltzer. They also need to figure out some way to measure how far or high their rocket goes!
For the lesson’s summary, students use their data sheets as they participate in a data talk, responding to questions such as, Which recipe worked the best? What does the data tell us? Based on the data, what recipe would you use next time?
Thinking about and responding to such questions helps students focus their attention and their recipe decisions on the data they’ve collected. Making sense of and using data is critical in making good decisions in the real world; decisions not made from someone’s opinion, but on reliable data collected from the field. For example, data science is used in making decisions for increasing sales in the retail industry, making predictions in the manufacturing industry, supply chain optimization in the logistics industry, and so on.
In the photo, two students work together to measure their recipe for one of the Alka Seltzer Rocket trials.
Use Data Talks Throughout the Year
The National Council of Teachers of Mathematics (NCTM, 2018) asserts that the primary aim of math education is to help students “understand and critique the world.” Data science can play a central role in reaching this goal.
By incorporating Data Talks throughout the school year, we can help students develop data literacy and prepare them with a skill set that is fast becoming vital to current and future occupations. As Jo Boaler notes, “The need to analyze and interpret data is no longer confined to engineering and computer programming; it has become an essential life skill.”
Although recording data about ratios of water to alka seltzer may seem quite distant from the tasks that data scientists at tech companies engage in, the foundational elements of looking at a data set, asking questions, and beginning to analyze are very similar. Developing an understanding of and love for data early in a student’s education might open doors for exciting and lucrative career paths later.
For more information on data science, see Jo Boaler’s website here. Also check out the New York Times’ What’s going on in this graph?